


Eagers Automotive – “a riddle wrapped in a mystery inside an enigma^”?
Here at Eiger we love a good quote (whose is that above and what were they describing? – looking at the footnote is cheating), and we keep getting told that nobody likes to read bland investment manager notes that factually review the positives and negatives of a monthly performance update. So here goes a note that we hope is a bit different.
When looking at the long-term case for Eagers Automotive a few quotes come to mind: From Warren Buffett
“When a management with a reputation for brilliance tackles a business with a reputation for bad economics, it is the reputation of the business that remains intact” and “You can put a great jockey on a broken-down horse, but the horse will still lose the race. The quality of the business is the horse, and management is the rider”
The management of Eagers Automotive will probably be aghast at the inference that their business has bad economics, but an analysis of the car distribution and auto industry generally would suggest otherwise. While the following chart (see Page 2 – Auto Sector Long Term Returns) is a bit difficult to dissect among the jumble of lines lets explain it. Using the start of last decade (when the AP Eagers share price was around $2.30 and we first met the then CEO Martin Ward) as a starting point we have charted the total returns of a range of companies exposed to the car industry.
This 16 year period removes any short momentum-generated returns that are now symptomatic of the investment markets in which we now operate. Over this period the major drivers of performance are strategy, return on capital, industry structure and management and staff culture. These are the factors that investors often talk about in investment interviews that are largely ignored in favour of high frequency trading and yesterday’s thought bubble. The 16-year period also neutralises to a significant degree the impact of the pandemic period which had a dramatic impact on this industry.
Over this 16-year period the S&P500 and the ASX200 have returned just over 800% and 250% respectively. It’s not the theme of this note but that evidence really makes the case for an ASX200 index fund hard work against the tech-rich S&P500.
Let’s start with some traditional car businesses. VW Group (Audi, VW, Bentley, Ducati and others), Ford, Stellantis (Fiat, Peugeot, Vauxhall, RAM, Chrysler and a few more) and BMW have returned -25%, 175% and 240% and 275% respectively. Porsche, which had some of the highest margins in the manufacturing industry until its EV program missed the mark, relisted as an independent entity just as this was becoming apparent and has declined 40% since mid-2022. So, manufacturing has been poor unless you were in BMW or Stellantis in which case it has been average.
New age Chinese EV manufacturer BYD has returned 240%, in the mix with the best traditional brands. But no better. CarMax and Carvana are two US-based used and wholesale vehicle retailers. CarMax has a larger physical presence whereas Carvana operates a digital only model. CarMax sells around 750k vehicles per annum which is close to double Carvana. Investors significantly prefer the capital-light digital model with Carvana delivering a 2800% return over this period as opposed to 120% for CarMax.
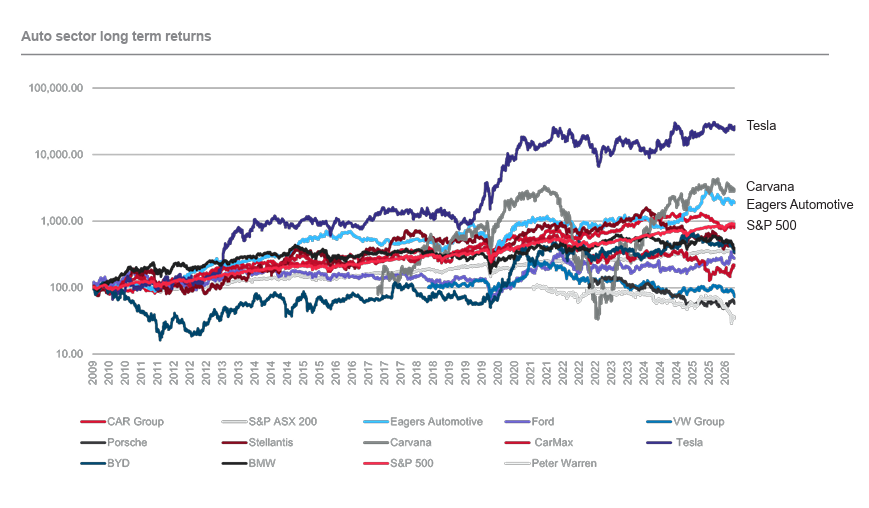
Our very own capital-light vehicle classifieds portal CAR Group has delivered a stellar 740%. Which brings us to Tesla. The world centre of the Elon Musk, tech, battery, EV, AI boom and the reason our chart above must have a log scale. Total return since the start of the 2010’s, 26,300%. Enough to help make somebody a trillionaire. Not so sure we can put all that down to Tesla cars but hey, it’s still a thing.
So where does Eagers Automotive fit within this very broad range of outcomes? Ignoring Tesla, Eagers Automotive is second over this period to Carvana with a total return of almost 1800%. The outcome seems frankly a bit ridiculous when you consider that Eagers is hardly capital light (it owns many of its retail sites and must fund a large amount of inventory). The next best business in our survey, with significant assets, is BMW with a total return of 275%. Eagers also have two listed peers in Australia, Peter Warren and Autosports. Peter Warren listed in 2021 and has returned -65% while Autosports listed in late 2016 and has roughly returned nothing with dividends over that period offsetting the share price decline.
So, what is the secret sauce? Where is the moat?
Market share growth has been consistent, driven organically and via takeovers (including the large bite of the dysfunctional Automotive Holdings in 2019). There have been periods when private equity has disrupted the incremental takeovers but that has evaporated.
Control of key sites which allow development without meddling landlords with their hand out. Much like Mainfreight, the NZ logistics success story. Culture and management consistency. There have been two CEO’s since we started following Eagers in 2010. Martin Ward was replaced by Keith Thornton who has been with the company since 2002. The Company Secretary, Finance Director and COO joined in 2008, 2017 and 2004. Promotion from within is clearly a factor.
The Board of Directors diversity is consistently questioned by proxy advisors for being semi-independent. We understand where proxy advisors are coming from but equally in this case the long-term industry experience on the Board seems to have resulted in minimal potholes along the way to disrupt constant capital compounding. The company has had to manage significant stakeholder relationships, notably with the major car brands that are successful in Australia and more recently by obtaining rights to distribute the rapidly growing brands from China. It’s really all the above and other factors. There is no patent or piece of irreplaceable technology.
So, what happens next?
Woolworths achieved a similar return from its IPO in mid-1993 over a 16-year period to 2009. In the subsequent 16 years from then to now the return on Woolworths shares has been around 200%. Is that a fair guide for what happens to Eagers Automotive over the next 16 years?
Factors to consider?
- Woolworths currently has around 36%-38% share of the Australian grocery market. That would represent a massive market share gain for Eagers from the current 15%. In 2009 Woolworths market share was not dissimilar to what it is now with Aldi and others largely growing at the expense of Coles2.
- Eagers are yet to really crack used cars which turnover more than three times the volume of new car sales and offer the potential for significant returns as demonstrated by Carvana. Having said that the outcome achieved by CarMax is more sobering. Eagers have a unique opportunity to achieve success in the used car market; their unprecedented and growing share of the new car market generates significant used car supply via trade-ins. The new venture in this space with Mitsubishi is certainly going to try.
- The Chinese manufacturers are grabbing this opportunity in the previously EV-sceptical Australian market. For the first time, pure ICE vehicle sales fell below 50% share in June 2026. BYD secured the No. 2 market share in the critical month of June and the No. 2 share over the FY26 financial year. It’s difficult not to believe these trends will continue. There is more manufacturer competition than has been the case possibly since the Japanese manufacturers really got going in 1980’s. Will this benefit the scaled distributor in this market?
Let’s go for another quote. The arrival of Chinese manufacturers and EV’s in Australia is like Ernst Hemingway describing how Mike went broke in His 1926 novel The Sun also Rises.
“Two ways. Gradually then suddenly.”
Look around you on the roads. Chinese EVs and hybrids are suddenly everywhere. Which brings us to Canada. The acquisition of a majority stake in CanadaOne with a market share of around 4% is roughly the same level as Eagers Automotive in 2010. Could this be 15% in 15 years’ time; a replicate of what has happened in Australia?
Summary
A base case could be that Eagers continues on the path from a leading 15% market share and delivers a return similar to Woolworths of 200% over the next 15 years. Equally opportunities in Canada, used cars, the current disruption in vehicle manufacturing and the prospect of much higher share in Australian new cars could see performance significantly higher. Key risk factors could include direct service and sales models that reduce the role of a car distributor. Either way the business track record over the last 16 years suggests an outcome better than the industry outcome. There is no doubt that so far the management reputation is superior to that of what is a difficult industry.
^Winston Churchill, October 1939. Describing the Soviet Union.
2. Source: Parliament of Australia investigation into Australian Supermarkets 2009, Morningstar 2026.
This material has been prepared by Eiger Capital Limited ABN 72 631 838 607 AFSL 516 751 (Eiger Capital). It is general information only and is not intended to provide you with financial advice or take into account your objectives, financial situation or needs. To the extent permitted by law, no liability is accepted for any loss or damage as a result of any reliance on this information. Any projections are based on assumptions which we believe are reasonable but are subject to change and should not be relied upon. Past performance is not a reliable indicator of future performance. Neither any particular rate of return nor capital invested are guaranteed.