
Profiting from IPOs
Do IPOs in Australia provide a good return for investors?
An IPO typically presents a snapshot of a business as it prepares to list. There is usually a “proforma” profit and loss and balance sheet which means that the accounts are not what actually existed just prior to IPO.
Post IPO the “proforma” business as it was presented, no longer has the ability to choose how and what to include in its accounts. Investors will own a share of a business that will progressively reveal how well it can deliver on its IPO investment outlook and how well its management, products and structure can cope with positive and negative surprises.
In this report, we update our database of over 2,200 IPOs that have taken place since the year 2000. We attempt to answer the question as to whether there is a degree of financial alchemy in the IPO process that causes underperformance as a business reveals its level of profitability and sustainable return on capital.
We will leave you to ponder the identity of the Wizards of Oz.
“In the end, alchemy, whether it is metallurgical or financial, fails. A base business cannot be transformed into a golden business by tricks of accounting or capital structure.”
Warren Buffett
1989, Annual Report
Berkshire Hathaway
These issues have been around forever!
“I can calculate the motions of the heavenly bodies but not the madness of people.”
Sir Isaac Newton
In 1720, while discussing the significant volatility surrounding South Sea shares, Sir Isaac Newton, who at the time was Master of the Mint, remarked that “I can calculate the motions of the heavenly bodies but not the madness of people.” For this reason, it is necessary to examine the performance of IPOs over a reasonable period of time to remove the impact of positive and negative short-term speculation and trading noise. We are interested in examining returns over a sufficient period for the business to report multiple interim and final results and to hold multiple Annual General Meetings. That way investors will be able to access value not just based on the snapshot presented at IPO but on multiple sets of accounts and presentations.
During the era of Sir Isaac Newton’s tenure as Master of the Mint there were all sorts of interesting capital raisings including those to create a wheel of perpetual motion and many to profit from trading with the newly discovered Terra Australis. What could possibly go wrong?
The sage of Omaha
Before examining the IPO data, we couldn’t resist one more classic Buffett quote. This one specifically on IPOs:
“It is almost a mathematical impossibility to imagine that, out of the thousands of things for sale on a given day, the most attractively priced is the one being sold by a knowledgeable seller (company insiders) to a less-knowledgeable buyer (investors).”
Warren Buffett
The Australian IPO market
We have used Factset to create a database of all the IPOs that have occurred in Australia between 1 January 2000 to 31 December 2021. Our database identified 2235 IPOs since that time. We have focused our attention on the 302 IPOs that raised over $50m (significant small cap IPOs). In 2014, for example, there were 37 IPOs greater than $50m; the most in any one year. The overwhelming number of IPOs are either Private Equity or Founder originated.
2235 IPOs since 2000. $146 billion raised
There were only 302 significant raisings (defined as >$50 million)
Chart 1: Australian IPOs since 2000
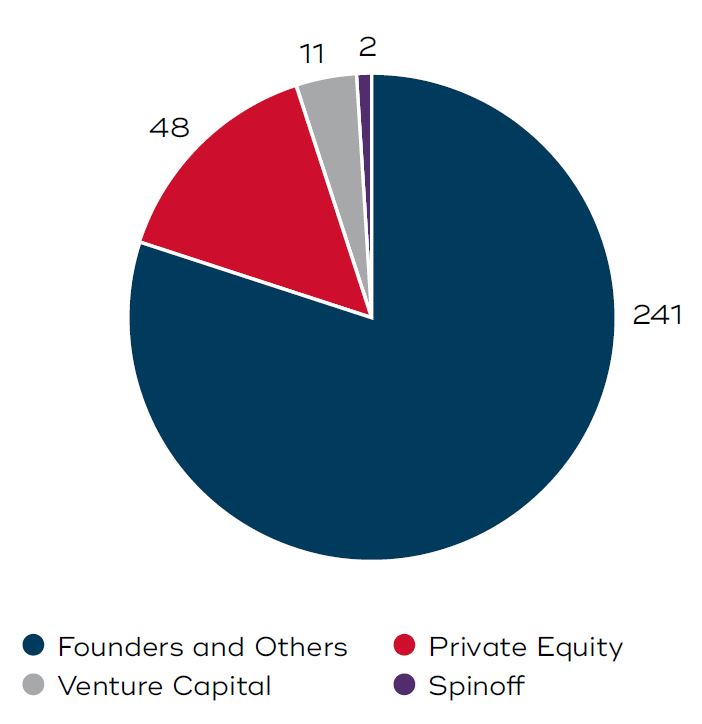
Source: Factset, Jan 2000-Dec 2021
Table 1: Velocity of significant raisings
| 2014 | 37 |
| 2015 | 31 |
| 2021 | 24 |
| 2005 | 21 |
| 2013/2017 | 20 |
| 2016 | 19 |
| 2004 | 18 |
| 2006/2007/2019 | 16 |
Source: Factset, Jan 2000-Dec 2021
Some more statistics
We have split the significant (>$50m) IPOs into two groups: those that raised $1,500m and those that raised between $50m-$1,500m. We have classified the larger group ‘midcap IPOs’ and the small group ‘small cap IPOs’. The larger group typically enter the ASX 100 almost immediately. This was the case with Medibank, Healthscope and QR National which are in this category. While this group individually raised the largest amount, they are by far in the minority. 96% of the IPOs $50m are the small cap variety and raise between $50m and $1,500m and transition to the small cap index. On average, these small cap raisings were for $234m each.
96% of significant raisings were small caps
There have been 11 IPOs that raised >$1500m since 2000
Magellan Global Trust, Viva Energy, Medibank, QR National and Healthscope were not small cap IPOs this decade. There were none in 2019-2021
Average raising of IPO below $50 million is $25 million
Average significant small cap IPO raised $234 million
Performance of significant IPOs
Largest IPOs on average appear to perform better
How have these IPOs performed? Including the larger (>$1,500m) IPOs reveals that the average, median and weighted average IPO performed roughly in line with the small cap (XSO) index for 6 months. However once we increase this to 12 months, the median IPO has fallen to -6% relative underperformance. The median IPO underperforms more than -12% over 2 years. However, in past years the underperformance between years 2 and 3 has stabilised. This year’s update, if anything, reveals ongoing deterioration in returns out to 3 years.
The weighted average raising outperforms over 1, 2 and 3 years indicating that the largest raisings perform significantly better than the smaller ones.
It is worth noting the significant outperformance over 3 years post-IPO of QR National
(+120% ahead of the XSO benchmark) which was also the second largest IPO (>$4bn raised) in our survey as the overwhelming driver of weighted average outperformance.
Chart 2: Performance of significant IPOs
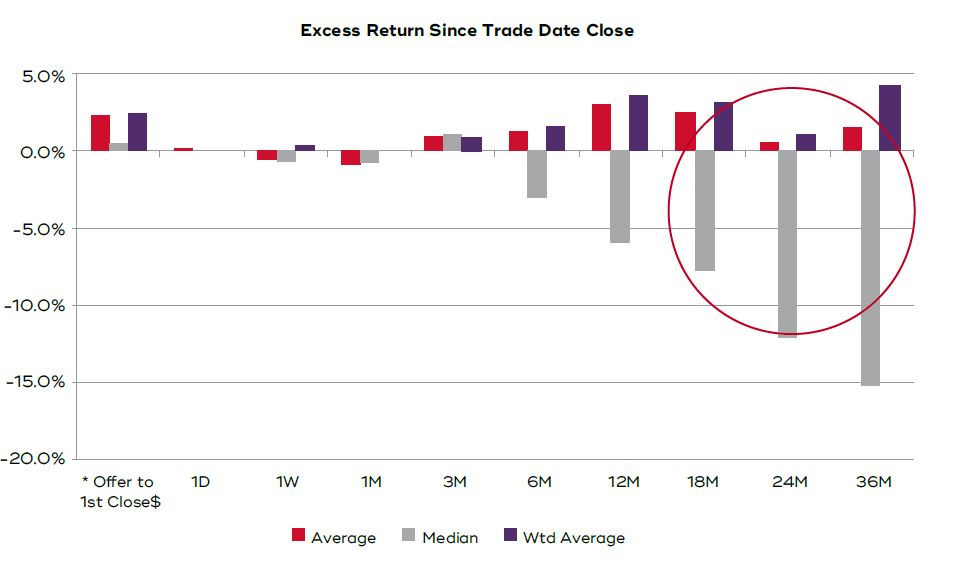
Source: Factset, Jan 2000 – Dec 2021
*Excludes IPOs with offer to 1st close absolute value >50%
Performance of significant small cap IPOs
Twelve months post listing the rot sets in
Excluding the larger IPOs significantly alters the picture if for no other reason than QR National is now excluded as it is a midcap IPO. The median small cap IPOs perform in line with the XSO index over 3 months but then performance deteriorates. The worst period of underperformance is between 3 months and 2 years. Between 2 years and 3 years underperformance vs the benchmark also steadies but does not improve. Once again the weighted average underperformance is not as significant as the median indicating that the larger raisings underperform less than the smaller raisings. However, excluding QR National, the weighted average is now comfortably negative over 2 and 3 years.
Chart 3: Performance of significant small cap IPOs
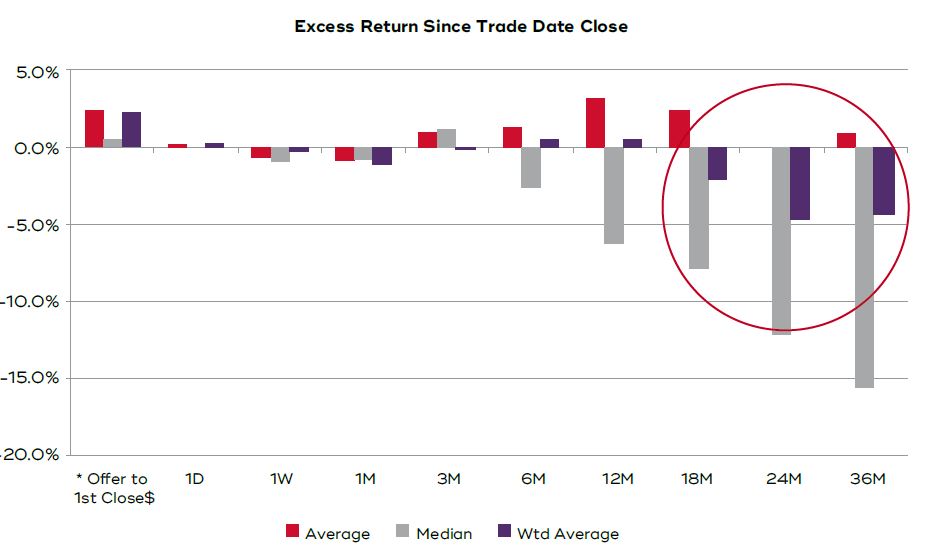
Source: Factset, Jan 2000 – Dec 2021
*Excludes IPOs with offer to 1st close absolute value >50%
The key conclusion that we draw is that it is between 3 months and 2 years when a company reveals its true long-term intrinsic value and earnings capability. On average the intrinsic value that is revealed is lower than what was described or expected at IPO.
IPOs in 2019 that have contributed to the 15% underperformance of this group over 3 years vs the XSO index include Tyro Payments, Limeade, Openpay, Nuchev, Openlearning, Damstra, VGI Partners and Carbon Revolution. These companies have all underperformed the XSO index by between 60% and 90% over the last 3 years.
In reviewing the numbers, we would note that the recent seasoning of 3 year numbers has revealed broad and significant underperformance. The best performing IPOs over the last 3 years have included Uniti Wireless and Home Consortium. Uniti Wireless initial price in early 2019 was below 20c. Its price at the end of 2021 was $4.45.
Are Small Cap IPOs a poor investment?
They can be unless you are very selective
Is the obvious conclusion to ignore all IPOs (except perhaps the privatisations of Government entities such as QR National) as, on average they underperform? We believe the answer to this question is no. While the median and the weighted average returns vs benchmark are negative, the spread between the best and the worst is very large.
Chart 4: Distribution of excess return
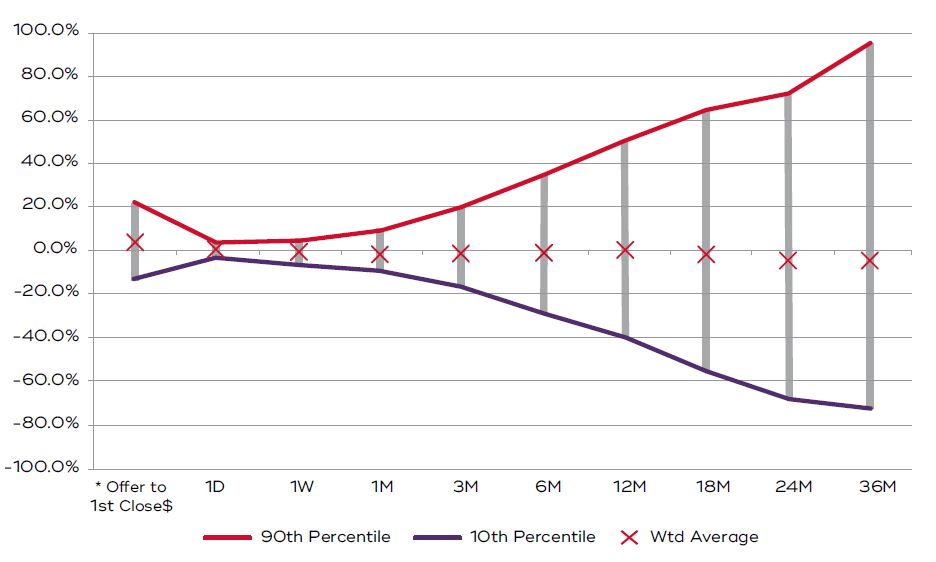
Source: Factset, Jan 2000- Dec 2021
Table 2: Excess return 1-3 years post-IPO
Source: Factset, Jan 2000-Dec 2021
1 Excess returns vs Small Ordinaries Index
2 Weighted by amount raised at IPO
- Median returns begin to decline between 3-6 months post IPO
- Median returns remain negative out to 3 years
- Weights average returns are in line over 1 year but then decline out to years 2 and 3
- But the best 30% added alpha while the best 20% added significant alpha
- The intial trade day returns are as volatile as returns over 3 months. There are big initial day winners…and losers
- Compared with our last IPO review 18 months ago, the performance of the 90th percentile has lifted while the 10th percentile has deteriorated
Key takeaways
IPOs require detailed analysis
The best 30% of significant IPOs outperformed the benchmark by 9.8% over 3 years. While this is only 3.2% p.a. the story gets better from here. The best 20% outperformed by 46.9% (13.6% p.a.) which is significant. The best 10% outperformed by significantly more again and delivered 96% or 25% p.a.
Chart 5: Excess returns vs small ords (p.a.)
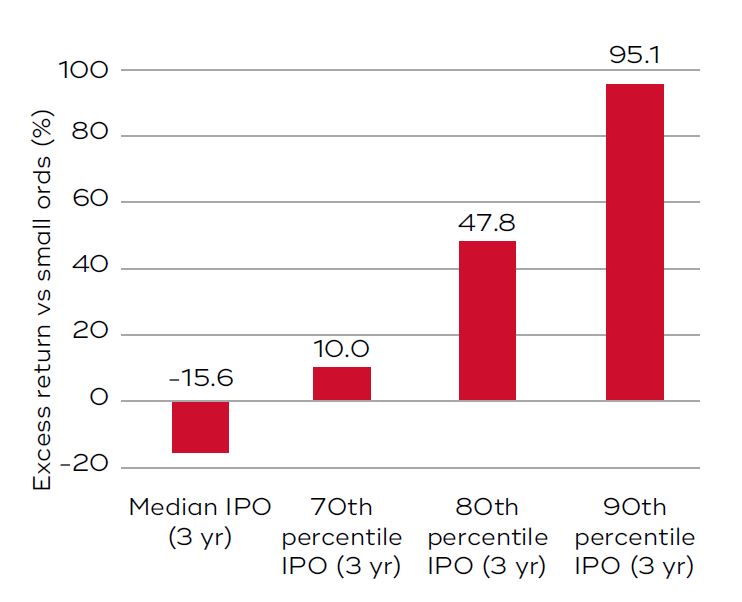
Source: Factset, Jan 2000-Dec 2021
We draw the following conclusions:
- Significant alpha is available by investing in IPOs.
- It is not always necessary to invest in the IPO as the outperformance of the best companies begins to really compound beyond the 3-6 month period.
- Investors need to be very selective. The worst 70% will deliver an index return at best and will possibly significantly underperform.
- The best 30% will deliver alpha vs the benchmark. However it is only the best 20% that will really make a difference to investing in the XSO benchmark.
- Significant returns are available, however the Devil will take the Hindmost!
Author: Stephen Wood, Principal and Portfolio Manager
This material has been prepared by Eiger Capital Pty Ltd (ABN 72 631 838 607 AFSL 516751) (Eiger). It is general information only and is not intended to provide you with financial advice or take into account your objectives, financial situation or needs. To the extent permitted by law, no liability is accepted for any loss or damage as a result of any reliance on this information. Any projections are based on assumptions which we believe are reasonable, but are subject to change and should not be relied upon. Past performance is not a reliable indicator of future performance. Neither any particular rate of return nor capital invested are guaranteed.