
Small cap investing – initial position sizing
One of the advantages of small cap investing is the size of the investible universe and the opportunity set it offers. There are approximately 500 ASX-listed companies between market capitalisations of $100m and $2.5bn. That number increases to ~700 if the lower bound is dropped to $50m and almost 1000 companies between $25m and $2.5bn market capitalisation.
So, a lack of choice is not generally a problem small cap managers face. At Eiger, we combine quantitative and qualitative processes to significantly narrow the field and indeed, have found many interesting opportunities that we ultimately invest in. The basis of our quantitative process is a cashflow-based model that has served us well for a decade-and-a-half. It generates an alpha-score, a valuation that essentially represents the compounding five-year return of an investment.
Finding appropriate investment opportunities is only part of the challenge. Another that we face is sizing our initial position in a company given less familiarity with new investments. Market experience plays a strong role in determining a sensible approach, but we like to enhance this view with a quantitative aspect as shown in the chart below. In essence, it schematically represents the expected risk/return profile for a new company. For example, the model suggests a company with an exceptionally high alpha of say 30%, should enter the portfolio with an initial weight of 50 basis points. This is a small exposure that limits the risk on the downside, but if our analysis is correct, allows the position to grow quickly (and perhaps be added to), without generating unnecessary trading costs. The high alpha score often results because a company is not well known or understood by the market and hence a degree of caution is prudent.
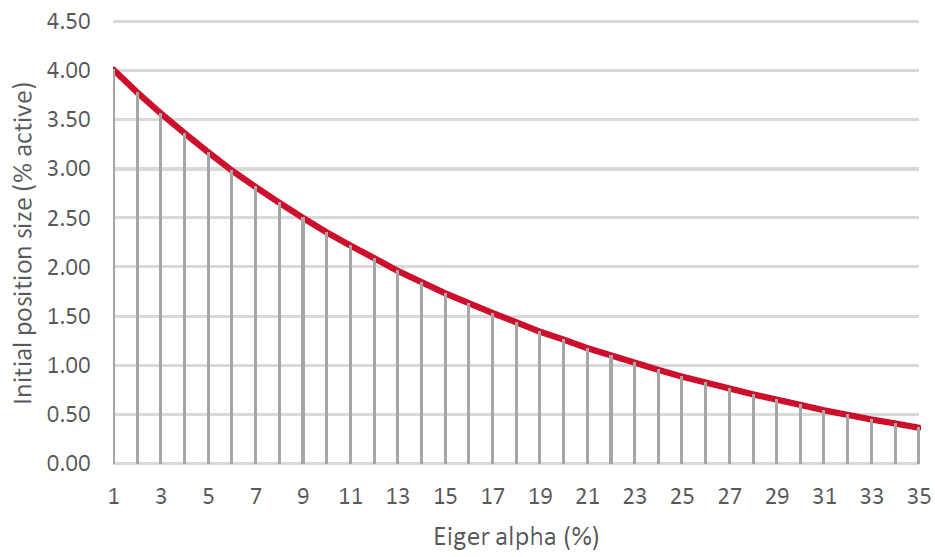
Source: Eiger Capital, Factset
It is important to stress that our model acts as a guide and is not prescriptive. This is because there are other factors to consider such as the business model, barriers to entry and quality of management. Another important feature of small cap investing, and for which it is sometimes criticised, is the volatility of the universe, which is often driven by liquidity constraints. The following chart is a representation of the three-year volatility of the Small Ordinaries Index (XSO, 200 stocks) with the mean and one standard deviation added. Approximately 80% of the index lies within one standard deviation of the mean but there are significant outliers.
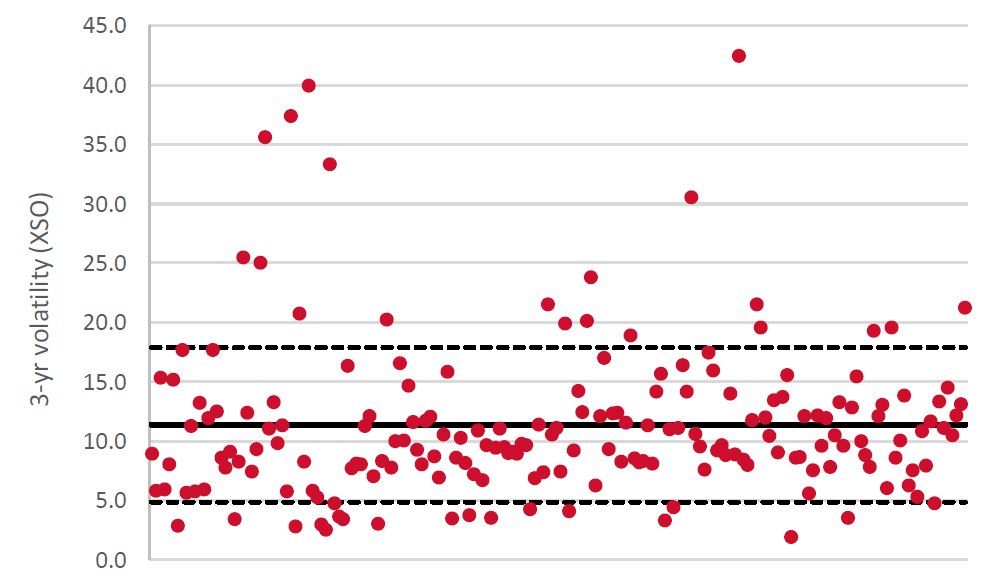
Source: Eiger Capital, Factset
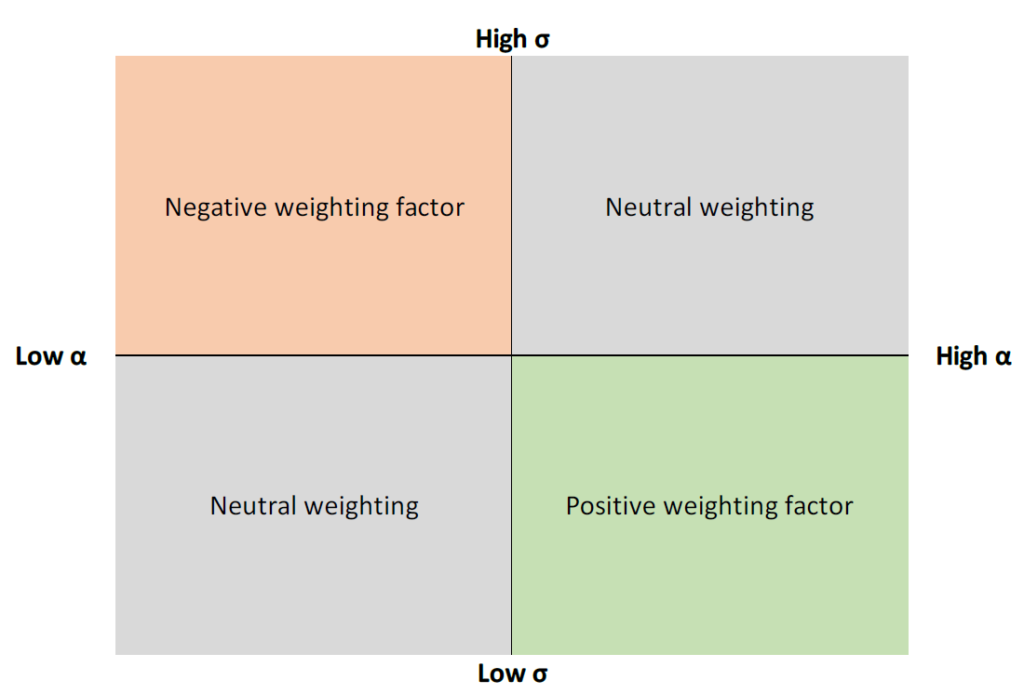
We can therefore overlay a volatility factor as a check on the appropriateness of our sizing model. As the chart below indicates, a company that has both high alpha and low volatility should perhaps deserve a higher initial weighting in the portfolio than the model alone would suggest, whereas a highly volatile, low-alpha opportunity would likely be smaller (if included at all) to account for heightened risk relative to the perceived return. We would intuitively think this way but it is helpful to have a quantitative measure as a ‘sanity check’. For while we seek to outperform the XSO, we wish to do so in a manner that is cognisant of the value of our clients’ capital.
Author: David Haddad, Principal and Portfolio Manager.
The information in this article is current as at the date of publication and is provided by Eiger Capital ABN 72 631 838 607 AFSL 516 751. It is intended to be general information only and not financial product advice and has been prepared without taking into account your objectives, financial situation or needs. Past performance is not a reliable indicator of future performance.