
The Devil Takes the Hindmost
Commodity Booms. Let’s start with tulips…
Speculation in commodity prices and the wave of hype that comes with it is not a new concept. Over the past few hundred years there are many accounts of the rise and fall of a commodity’s price fuelled by speculation and the promise of great profits in short term trading. Eiger has a team favourite – Tulip Mania. We see this recurring pattern of market behaviour and have used it as a reminder as we follow the current market. Over the last 12 months we have seen a huge rise in lithium and rare earth prices (which we categorise as advanced materials) following increasing demand for renewables and electric vehicles. We see clear parallels between the market now and the market for iron ore in 2006-2008 as China embarked on massive infrastructure spending.
Let’s set the scene for our comparison in the early 1630s where conditions in the Dutch republic were prosperous and increasing commercial optimism drove significant economic growth. The price of a single bulb for a desirable Tulip variety could cost the equivalent of a small townhouse in Amsterdam. By the mid-1630s, a strong market for Tulip trade existed within the Dutch Republic on news of rising demand and prices for Tulips in Paris.
During late 1636 and early 1637, before planted Tulip bulbs had begun to sprout for spring, prices of Tulips of all varieties begun to soar. First, the rarest, most sought after varieties promising the greatest bloom climbed, but varieties of all shapes, sizes and quality followed soon after. A Gouda bulb climbed from 20 to 225 guilders, The Generalissimo variety from 95 to 900, and the Yellow Croenen from 20 to 1200 in just a few weeks – the equivalent of 1 month’s wage up to 5 years’ wage. Credit agreements were formed for delivery of the yet to emerge blooms based merely on the prospective bloom of a bulb of a given size, weight and variety. On February 3rd 1637 as spring neared, the Tulip market collapsed suddenly and agreements were torn up. In the years following Tulip Mania, prices of the most desirable varieties eventually returned to their pre-mania levels whilst lower quality, unknown and undesirable varieties never recovered. Those awaiting a healthy payment in the spring of 1637 were left empty handed. We can’t help but take some insight from Tulip Mania and the years that followed.
…and then shift to iron ore…
Are there parallels with iron ore from 2006 through to 2008? As the world economy continued to recover and grow post a significant disruption in the early 2000s, China began to emerge with significant expansion and an insatiable demand for iron ore to fuel a growing steel industry. Demand continued, main Australian players BHP and Rio Tinto were unable to meet demand, iron ore prices climbed, and new iron ore projects began to surface as they became economically feasible. Of these prospective projects, Fortescue Metals is one that stood out due to its relative simplicity, infrastructure, sheer scale and cost effectiveness.
In 2008 the global financial crisis hit creating significant headwinds and undermining the stability of lenders and the availability of credit. Speculator confidence fell, as did equity prices and therefore miners’ ability to raise capital through equity. Only those with strong, pre-existing backing were able to secure the necessary funding to continue their projects. With demand continuing to exceed supply Fortescue was able to complete their project and go on to profit immensely. Timing was everything. As you will see charted on page 3, most projects, however, did not fare so well…
“They have dreamed out their dreams, and awaking have found nothing in their hands”
Using January 2006 as an index base of 100, our iron ore aggregate of 11 stocks grows to a peak of 902 (average indexed value of all 11 stocks) by the end of May 2008.
Murchison hit an indexed peak of 1340, Atlas 1457, and Fortescue 2167. During mid to late 2008 when the GFC hit, equity markets declined significantly, and debt markets froze. All these companies were in the early stages of their development. Even Fortescue that was in production by now fell using this index to a value of around 350. This still represents a >200% return for investors from the start of 2006 but also an 85% decline in 6 months. The timing of the takeout of Midwest could not have been better for Midwest shareholders.
In late 2008 China implemented a massive infrastructure program to boost the economy in the wake of the GFC. This lifted our index to around 430 by the middle of 2011. The Atlas Iron share price also lifted significantly during this period. However, we remember well the differences between Fortescue and Atlas during this period. Atlas continued to contract mine the Wodgina iron ore deposit and truck ore to Port Hedland. The Wodgina deposit was never large nor high quality. The company was, however, able to generate significant short term cashflow by taking over the road, camp, and electricity infrastructure from the mothballed Wodgina tantalum mine and avoid heavy investment. Port facilities were also rented. Atlas was never able to repeat this outcome at another location. Infrastructure investment to lower operating costs was never forthcoming. Atlas was ultimately purchased by Hancock Prospecting in 2018 for approximately 1/100 of the peak share price (adjusted for share issues).
Atlas, we believe, is a metaphor for the emerging iron ore sector from 2004 onward. Fortescue achieved profitable production with infrastructure and scale, paid down debt and was then sustainably profitable enough to keep re-investing. It raised significant amounts of capital very early in the China boom when the markets were willing to provide it. Fortescue also got a large amount of infrastructure built before costs in Western Australia rocketed upward in the face of massive LNG investment post GFC. Atlas and its peers could only make a profit when prices are high. They never managed to thread the needle to achieve lower costs and sustainable cashflow at scale.
Fortescue was completely different. It had invested heavily in its own rail and port infrastructure and achieved significant economies of scale by investing the windfall profits it made during this period. It achieved scale economies that have stood the test of time and enabled it to generate the required cashflow to expand infrastructure and the number of mining provinces. It was also able to generate the required profits and free cashflows that allowed it to replace its initial contracted-out mining and crushing operations with its own mining truck fleet and crushing facilities. It now had the freedom to use its strong free cashflow to invest in further capital facilities that lowered its unit operating costs.
Ultimately iron ore prices fell from their peaks and all the prospective (i.e. higher unit cost) junior miners either failed or returned to being producers at small volumes with barely sustainable profits. As the chart below highlights, they have all basically disappeared whilst Fortescue now has a market capitalisation of over $50bn. Global Iron ore supply, which was dominated by 3 very large producers prior to the China led demand boom of 2006 onward, is now dominated by 4 including Fortescue.
Iron Ore
Indexed from January 1st 2006
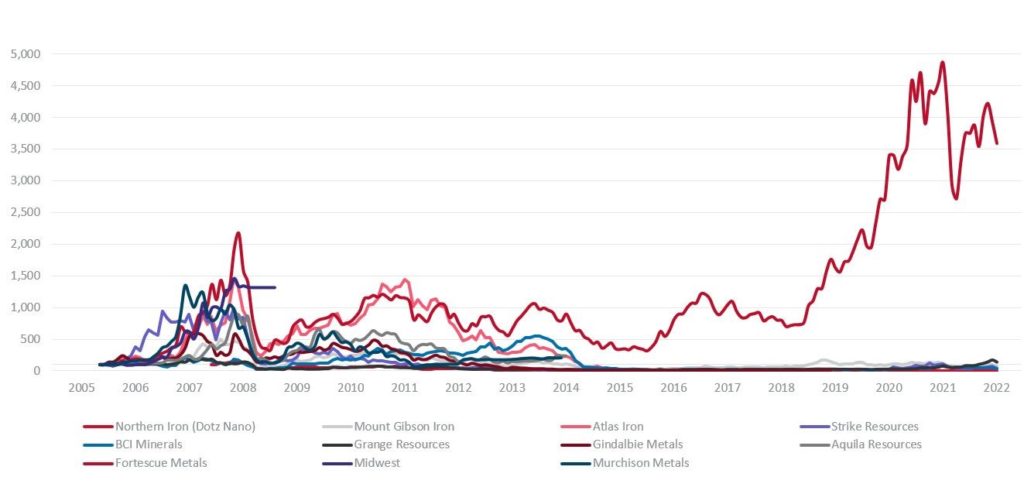
Source: Eiger Capital
“A rising tide floats all ships, even the most unseaworthy”
..and finally to advanced materials.
During 2021 and the first half of 2022 we have seen a significant rise and fall in the share price of companies with advanced materials mining projects. Early this year there was a sudden surge in the prices of several Australian listed companies who claim ‘tier one’ or ‘world class’ opportunities in the advanced materials mining space. This surge has also been associated with many of these companies being included in the S&P ASX 200 index for the first time. Most of these companies, however, have yet to mine a single ton of ore. Ironically it is these companies that have surged the most. EV manufacturers Tesla and Ford have recently engaged prospective lithium projects directly to set up off-take agreements in the hope of securing potential new supply before competitors – others are starting to follow their lead.
When considering a potential investment in an advanced materials company, during the current boom we look for, amongst other factors, one key feature – whether the company is currently mining and processing ore. Like Fortescue in 2008 the heightened interest in advanced materials is now 3-4 years old. The boom is well underway. In the chart on page 5, of the 11 companies we’ve used, there are only 3 companies that mine, process ore and generate sales (Pilbara, Allkem and Lynas). The rest of the group claim to be at best 1-2 years away from producing any material from a variety of methods such as evaporation of lithium salts from ponds, rare earths as a by-product of mineral sands processing, open pit mining, underground mining, and even processing of mud containing lithium. Each method has its own benefits and challenges impacting cost, reliability and scalability. Post concentration processing of rare earths in particular is very complex.
Many projects are in politically very unstable jurisdictions and could face significant environmental and modern slavery scrutiny from prospective clients. Large auto manufacturers are very protective of their brands and will not want child labour contributing to a hundred-thousand-dollar car. Irrespective of the method, most of the 11 companies are faced with the challenge of pre-production projects to commission infrastructure that will facilitate production.
Under normal conditions, commissioning scalable operations is no easy feat and in our experience is rarely completed on budget or on time. In 2022, many companies are faced with labour shortages compounded by disrupted supply chains causing materials shortages and cost inflation. In a June 2022 update from Dacian Gold, we learnt that their operating costs had increased 50% in the preceding months, a figure echoed by other gold producers, St Barbara and Evolution Mining. St Barbara highlighted that this issue is not just limited to Western Australia. Ignoring the challenge of securing necessary labour to carry out these projects, and the difficulty in securing materials and equipment, a 50% increase in costs is a significant challenge to proposed project plans and feasibility studies.
In the current environment of cost inflation, subdued capital market conditions and increasing interest rates, obtaining additional funding to meet project targets is likely to be increasingly difficult. These companies must endure winter before they can harvest in spring. We believe that conditions have now replicated the LNG and iron ore investment boom of 2006-2014. Chevron’s Gorgon project was never supposed to cost US$40bn and Western Australia lollypop workers were not expected to receive multi hundred thousand dollar pay packets.
With growing demand for renewable energy generation and storage, and electrified transport, demand for advanced materials has been increasing rapidly. A 3MW wind turbine (key to the renewable energy transition) requires roughly 2 tonnes of rare earth minerals for permanent magnets. In 2021, roughly 31,000 wind turbines were added (~94GW of energy generation) and this figure continues to accelerate. EVs are being ordered at an accelerating rate and require the same rare earth minerals and a significant portion of the global lithium supply. There is a significant deficit in supply for these materials which is forecast to continue beyond 2030 according to recent research by Macquarie. We see this as a similar mix of factors and positive forecasts to the iron ore market 15 years ago. Yet most companies have disappeared!
Despite significant optimism, the price of advanced materials and the enthusiasm of the equity market will likely go through cycles between now and 2030 making the funding and commissioning of new very long-term projects very difficult. The seaborne trade of iron ore is significantly bigger than it was 15 years ago, yet prices and trading conditions have varied significantly over this period. Almost all prospective iron ore hopefuls have gone. These high prices and strong outlook will also attract management and companies more interested in mining the share market as opposed to the ore market. It is often very difficult to know who-is-who before it is too late.
Like Fortescue from 2008 onward we believe that 2 companies, Lynas Rare Earths and Pilbara Minerals in the advanced materials space in Australia have “threaded the needle” and have achieved a low unit cost, profitable, scalable position in rare earths and lithium respectively. Both are now generating significant cashflow and can fund ongoing refinements and growth in their operations. Lynas is funding a range of expansion projects in Australia and the US (with significant help from the US Government) . Pilbara have just announced a new range of expansion plans including a plan to deploy some of their strong current free cashflow and replace their contracted-out mining and crushing operations with their own mining and crushing fleet. Sound familiar? Just like Atlas discovered, if you outsource all these processes, you are unlikely to make a profitable margin unless prices happen to remain very high after operations commence.
We see unfinished projects as now having significant downside from cost over runs and delays in achieving production. We would also note that while we don’t regard rare earth and lithium as “bulks” in the iron ore and coal sense and therefore don’t require the same scale of rail and port infrastructure, they do present their own unique challenges. Rare Earths are very complex to separate. For example the Lynas rare earths separation plant in Malaysia has 913 separate solvent extraction processes compared to a typical gold company that has 30-40.
Hard rock lithium mining also has its share of difficulties. For one, a particularly hard ore body has its crushing and processing challenges. This is part of the reason why Pilbara chose to use a specialist contract crushing service provider to help derisk the initial commissioning of their new mine in 2018/19. Onsite lithium concentrating is more difficult than drill, blast, and ship of iron ore. In most equity market and management presentations, the working capital required when mining commences is materially underestimated. Maintaining a workforce often for over a year whilst encountering operational issues and delivering poor-quality initial product is very expensive and consumes cash. Remember during this period any sales are likely to receive significant penalties for off spec product.
Our advanced materials chart on the following page starts January 1st 2020 at a base of 100 and the aggregate of 11 companies hits 2599 at the end of March 2022. We note that this rally covers 821 days before peaking and the length of the rally for iron ore was roughly 880 days to peak. We see peak indexed values in March 2022 of 3500, 4000, 6000, and even over 9000 for individual companies. We would like to highlight the producing companies, Lynas, Pilbara and Allkem are hidden as relatively flat lines at the base of the chart. From the late March peak, the advanced materials aggregate is down 40%. Lake resources is worst hit with a 60% fall.
We have used project risk as a key factor in selecting our lithium and rare earths investments. Pilbara Minerals and Lynas Rare Earths remain two of the most attractive options given their proven track record of profitably mining, processing and delivering ore in environments of far lower commodity prices. We see unfinished projects as adding significant downside risk to potential investments and employ lessons learnt from iron ore companies 15 years ago. In line with Eiger’s focus on companies’ ability to generate long term return we value companies with proven track records of production as most likely to survive a difficult period and deliver returns.
Advanced Materials
Indexed January 1st 2020
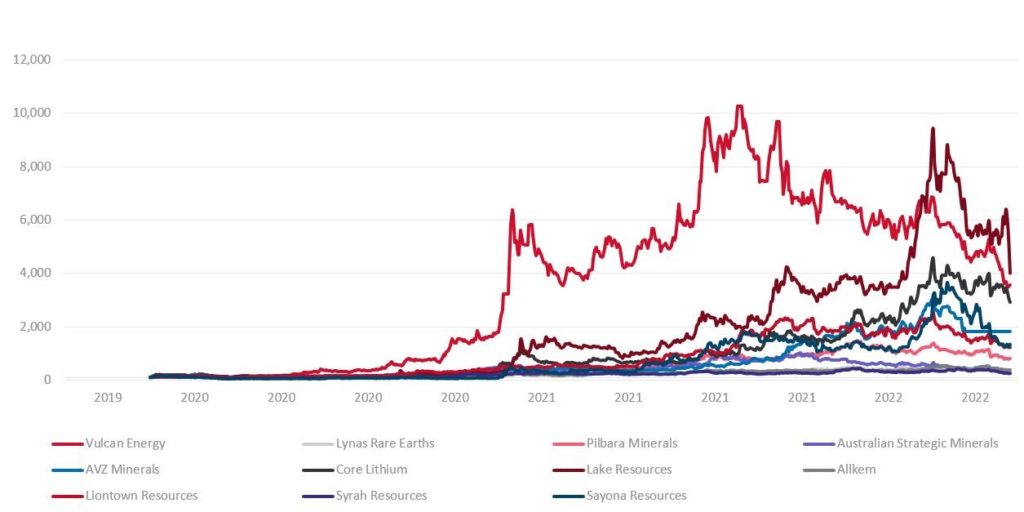
Source: Eiger Capital
Author: Stephen Wood, Principal and Portfolio Manager
Disclaimer
This material has been prepared by Eiger Capital Pty Ltd ABN 72 631 838 607 AFSL 516 751 (Eiger). It is general information only and is not intended to provide you with financial advice or take into account your objectives, financial situation or needs. To the extent permitted by law, no liability is accepted for any loss or damage as a result of any reliance on this information. Any projections are based on assumptions which we believe are reasonable, but are subject to change and should not be relied upon. Past performance is not a reliable indicator of future performance. Neither any particular rate of return nor capital invested are guaranteed.