
The New Small Cap Reality
Navigating Heightened Volatility and Reduced Liquidity
As the 2025 financial year fades into the rear-view mirror, the approaching August reporting season casts a spotlight on a fundamentally altered Australian small cap landscape.
The listed Australian small cap market has undergone an evolution over the past several years, driven by changes in investing styles, a decline in free float/liquidity and a lack of new issuers. This has in turn led to increased volatility and falling liquidity for investors. We continue that theme here with an eye to August and what it may hold.
A Shrinking Investable Universe
Hasan Tevfik of MST Financial recently highlighted a 15-year structural decline in new ASX listings. We have previously explored this factor in our April 2025 Quarterly Insights note. This prolonged slowdown has coincided with a surge in mergers and acquisitions, which has effectively ‘cherry-picked’ many of the ASX’s top companies, removing them from the investable universe. Notable examples include Altium, Afterpay, Allkem, Alumina, AusNet, Blackmores, Boral, CIMIC, Crown, CSR, Link Administration, Newcrest, Oil Search, Oz Minerals, PSC Insurance and Sydney Airport. Many of these takeovers were driven by foreign or unlisted buyers, contributing to a significant decline in ASX market liquidity. A rise in daily stock volatility is one of the resulting side effects of this trend.
The Concentration of Capital
Another factor contributing to this challenging trend is the rapid growth of institutional pension funds and self-managed super funds (SMSFs) in Australia. Both have been expanding at rates that outpace the growth of the ASX equity market. As a result, capital has become increasingly concentrated in a shrinking pool of ASX-listed companies. This has driven valuations for these stocks to historically high levels, lifting overall market valuations. Tevfik estimates that institutional super funds and SMSFs are collectively now estimated to own over 50% of the Australian equity market.
As predominantly long-term holders, their presence further reduces market liquidity. As also discussed in our April Quarterly Insight note, one other factor to consider is the rising share of the ASX represented by quantitative and passive funds. As we observed in that note they now account for around 20% of the ASX. Their ‘robotic’ rules-based trading behaviour is usually ‘value-agnostic’ and only adds to the decline in ASX market liquidity and rising volatility.
Heightened Volatility: The New Normal
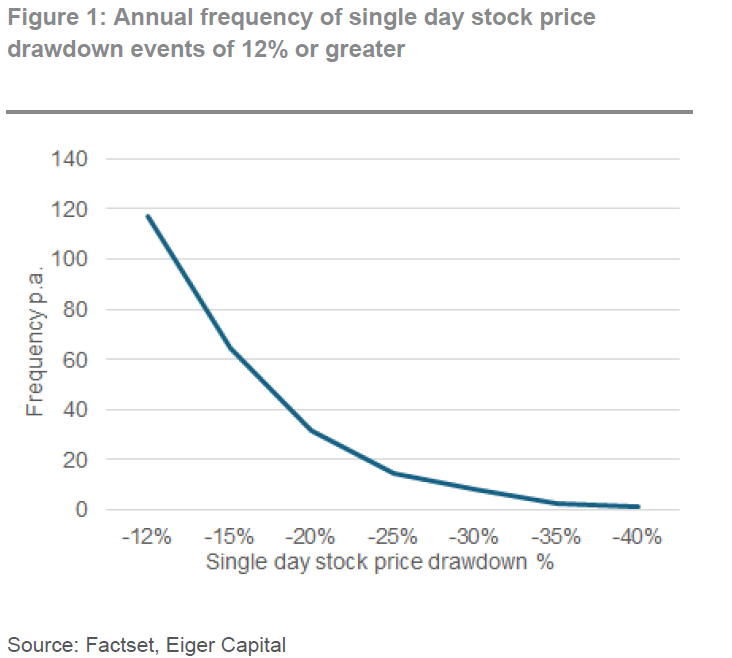
These changes have resulted in a much more volatile trading environment. We’ve observed that negative shocks in individual stock prices have become more prevalent, with even modest disappointments often leading to substantial losses in market value. Drawdowns of 12% or more are now a common occurrence, happening approximately twice per week across the ASX 300 since January 2022 (Figure 1).
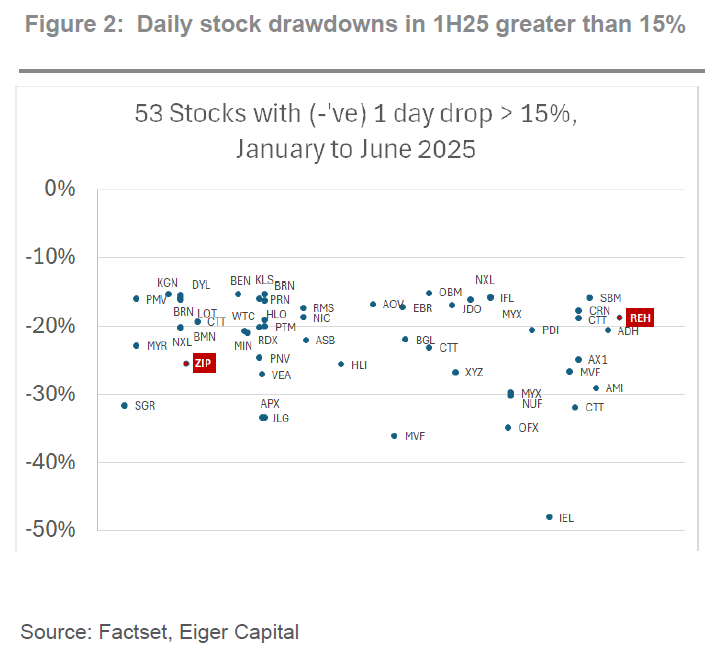
The first half of calendar year 2025 proved to be an exceptionally active and challenging period for significant stock price drawdowns. Between January and June 2025, we observed 53 instances where individual stocks experienced a 15% or greater daily decline (Figure 2).
Fortunately, our small companies fund was minimally impacted, experiencing only two of these drawdowns during 1H25 (REH and ZIP). These are highlighted in red below and discussed in more detail later in this report. As the saying goes, a picture tells a thousand words, and Figure 2 vividly illustrates a landscape of extreme volatility, especially within the small caps index during this period.
Decoding Drawdowns: Frequency and Magnitude
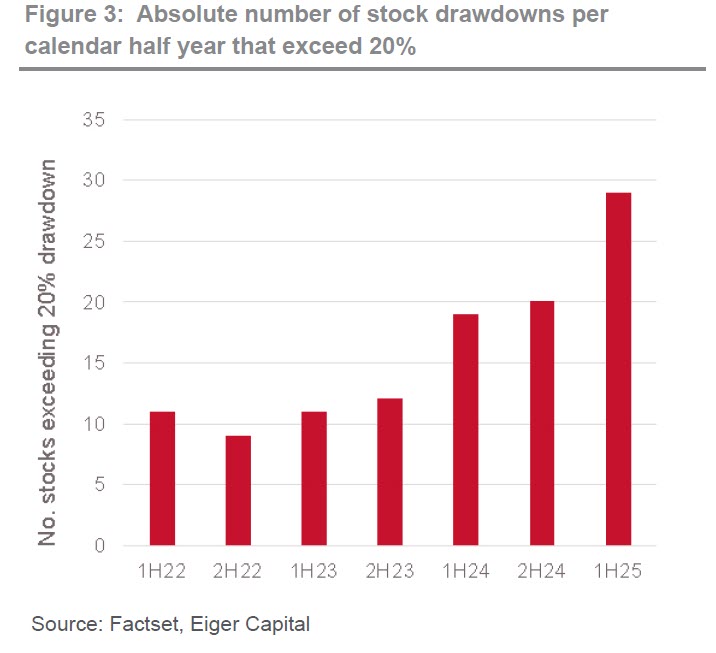
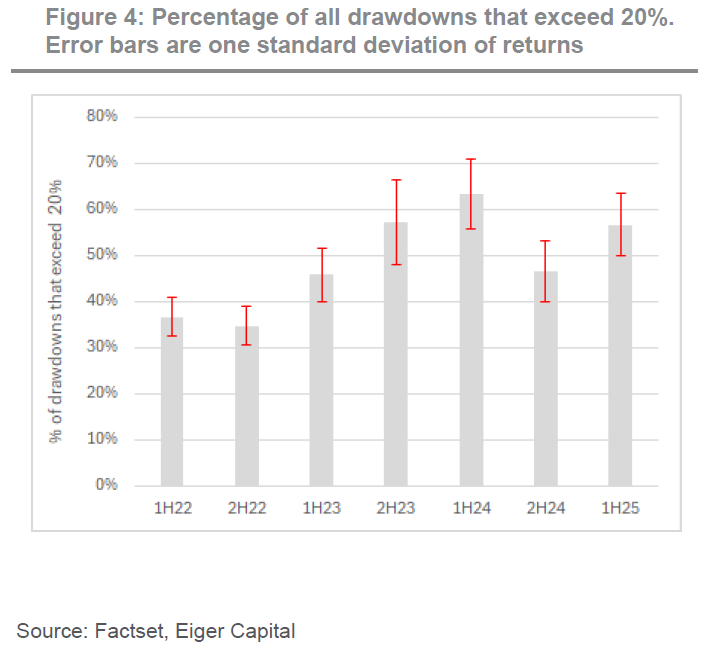
More extreme cases see a -20% move every seven to eight days, while a -30% drop occurs about once every 30 days. The absolute number of drawdowns exceeding 20% has shown an increasing trend over recent calendar half-year periods (Figure 3). While the percentage of total drawdowns exceeding 20% is more variable, Figure 4 indicates a general step-up in this trend, with larger losses now accounting for about 50% of the total.
Navigating Seasonal Shocks
It’s no surprise that February and August are the most active months for significant negative stock price returns, with August experiencing the highest frequency of negative shocks (Figure 5).
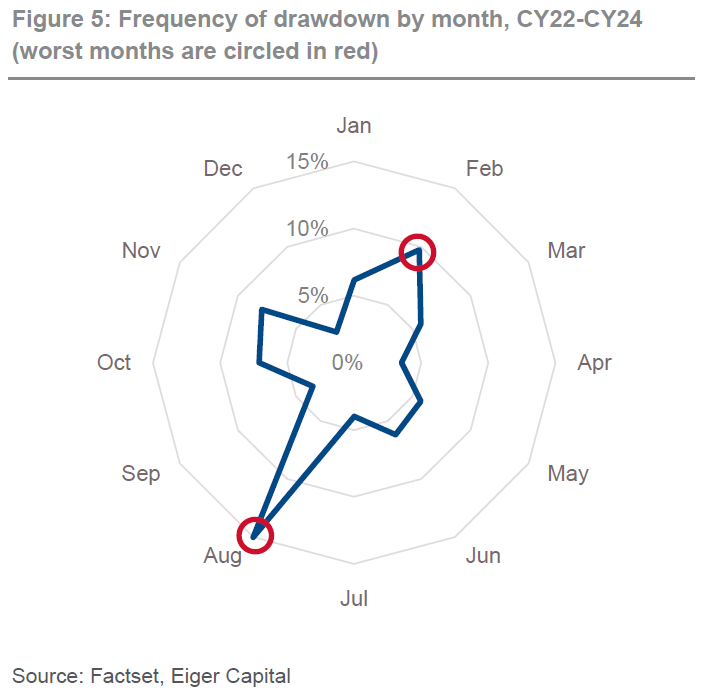
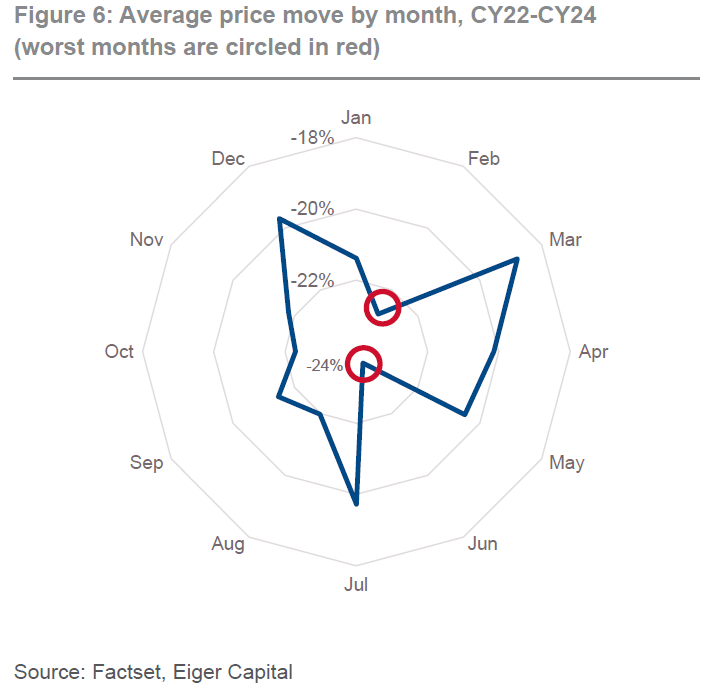
Regarding the size of declines, February ranks as the second- worst month with an average drop of -23%, while August is fourth at -22% (Figure 6). For context, June is the most negative month, averaging a -24% decline, ominously fitting as it aligns with the winter solstice’s darker days. The month of June is often when management reviews year-to-date performance before the financial year-end, often prompting the dreaded “Trading Updates” that drive sharp share price volatility.
As the ASX listed market structure evolves, presenting both opportunities and risks, we will cautiously manage small cap capacity to address the observed cyclical and structural decline in liquidity within the Australian small cap investment landscape. Our analysis highlights the importance of navigating this shifting liquidity environment, particularly during the two key ASX reporting seasons. With the August reporting period approaching, recent trends indicate it will likely again be a significant and eventful period.
Adapting to the Environment: Investing in a Liquidity Constrained Market
Given these trends, approaching the August reporting season with trepidation is understandable. At Eiger, we believe managing fund capacity for pure small cap exposure is crucial to mitigating increased market volatility. The days of consistently delivering alpha from managing an ASX small caps fund with Funds Under Management (FUM) of $1 billion or more appear to be fading.
While it’s impossible to dodge every stock disappointment, a smaller fund size offers greater flexibility to adapt when plans falter or new possibilities emerge. As shown in Figure 2, over the past six months our small caps fund faced setbacks with Zip (-25% in January 2025 due to missing VA consensus), which we capitalized on by increasing our stake, and Reece (-19% in June 2025 after a 6% EBITDA downgrade). Despite Reece’s outstanding operating track record, we now believe the company faces medium-term macroeconomic challenges beyond their direct control, prompting us to recently exit the position. Notably, these were the only two stocks we held that saw daily share price drops exceeding 15% in the last six months. This compares to the 53 stocks in our investable universe that experienced similar declines (Figure 2). Our focus on liquidity management allows us to act swiftly and better respond to the stock volatility that impacts our fund.
Reporting Season – here we go!
As the ASX listed market structure evolves, presenting both opportunities and risks, we will cautiously manage small cap capacity to address the observed cyclical and structural decline in liquidity within the Australian small cap investment landscape. Our analysis highlights the importance of navigating this shifting liquidity environment, particularly during the two key ASX reporting seasons. With the August reporting period approaching, recent trends indicate it will likely again be a significant and eventful period.
Author: David Haddad, Principal and Portfolio Manager
This material has been prepared by Eiger Capital Limited ABN 72 631 838 607 AFSL 516 751 (Eiger Capital). It is general information only and is not intended to provide you with financial advice or take into account your objectives, financial situation or needs. To the extent permitted by law, no liability is accepted for any loss or damage as a result of any reliance on this information. Any projections are based on assumptions which we believe are reasonable but are subject to change and should not be relied upon. Past performance is not a reliable indicator of future performance. Neither any particular rate of return nor capital invested are guaranteed.